
Evaluator
Glenn T. Hefter School of Mathematical and Physical Sciences, Murdoch UniversityEvaluation
Quantitative solubility data for the ethylbenzene (1) -water (2) system have been reported in the publications listed in Table 1.
The original data in all of these publications are compiled in the Data Sheets immediately following this Critical Evaluation. Critical phenomena at high pressures have been reported by Alwani and Scheider (ref 12) and Roof (ref 13) and are discussed along with the high pressure solubility data (ref 9, 24) in section 3 below. For convenience, further discussion of this system will be divided in three parts.
In the tables that follow values marked with an asterisk (*) have been obtained by the Evaluator by graphical interpolation of the original authors' experimental data. 'Best' values have been obtained by averaging all non rejected data. Standard deviations (σn) have been included as a convenient measure of the spread of experimental results: they do not have any statistical significance.
1. SOLUBILITY OF ETHYBENZENE (1) IN WATER (2)
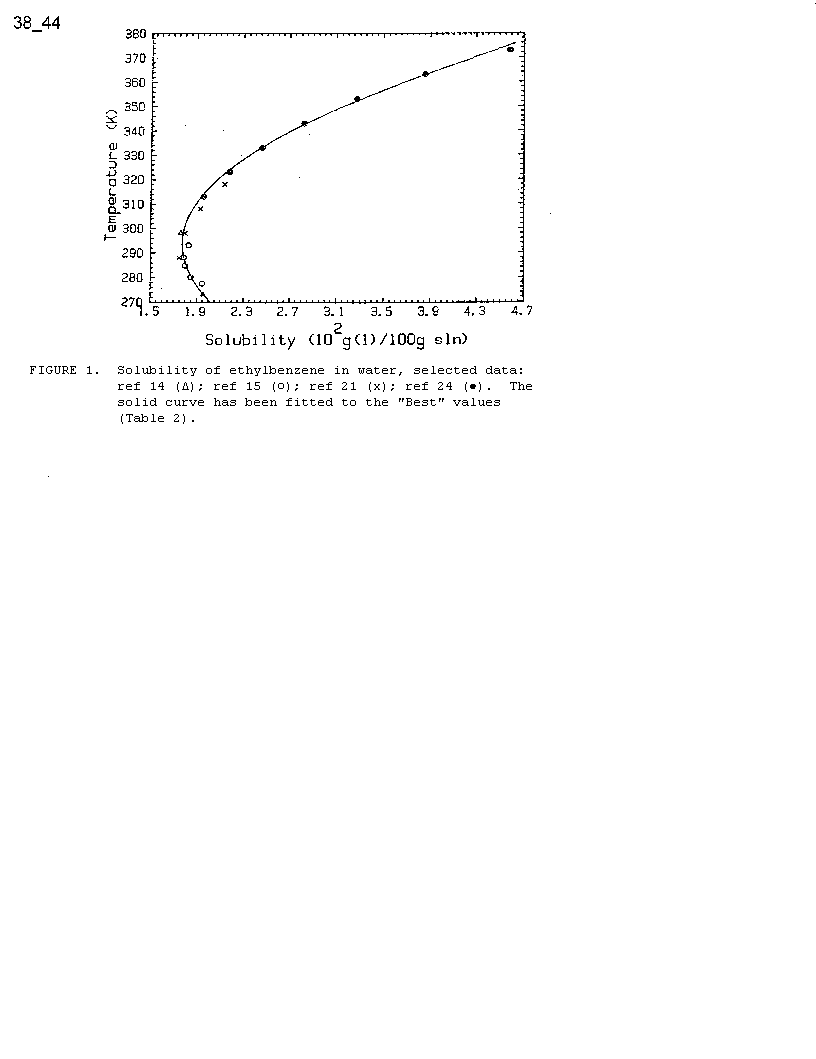
Of the data available on the solubility of ethylbenzene in water, values of Bohon and Claussen (ref 4) and Korenman and Aref'eva (ref 18) have been rejected because they are significantly higher (by about 10%) than all other studies. The value of Price (ref 17) at 298K is markedly lower than all other studies and is also rejected . The datum of Krzyzanowska and Szeliga (ref 20) has been excluded from consideration because it does not appear to have been obtained independently of that of Price (ref 17). The remaining data are summarized in Table 2 and are generally in excellent agreement even though few studies have covered the same temperature range (which has limited the number of Recommended values). Selected data are also plotted in Figure 1.
Thermodynamic functions for the dissolution of ethylbenzene in water derived by application of the van't Hoff equation are summarized in Table 3. With the exception of the data of Brown and Wasik (ref 15) which were obtained over a limited temperature range (Table 1), the ΔHs1n and ΔCp,s1n derived from the various values are quite close to reliable calorimetric values reported for the dissolution of benzene in water. This gives added confidence to the solubility data in Table 2.
2. SOLUBILITY OF WATER (2) IN ETHYLBENZENE (1)
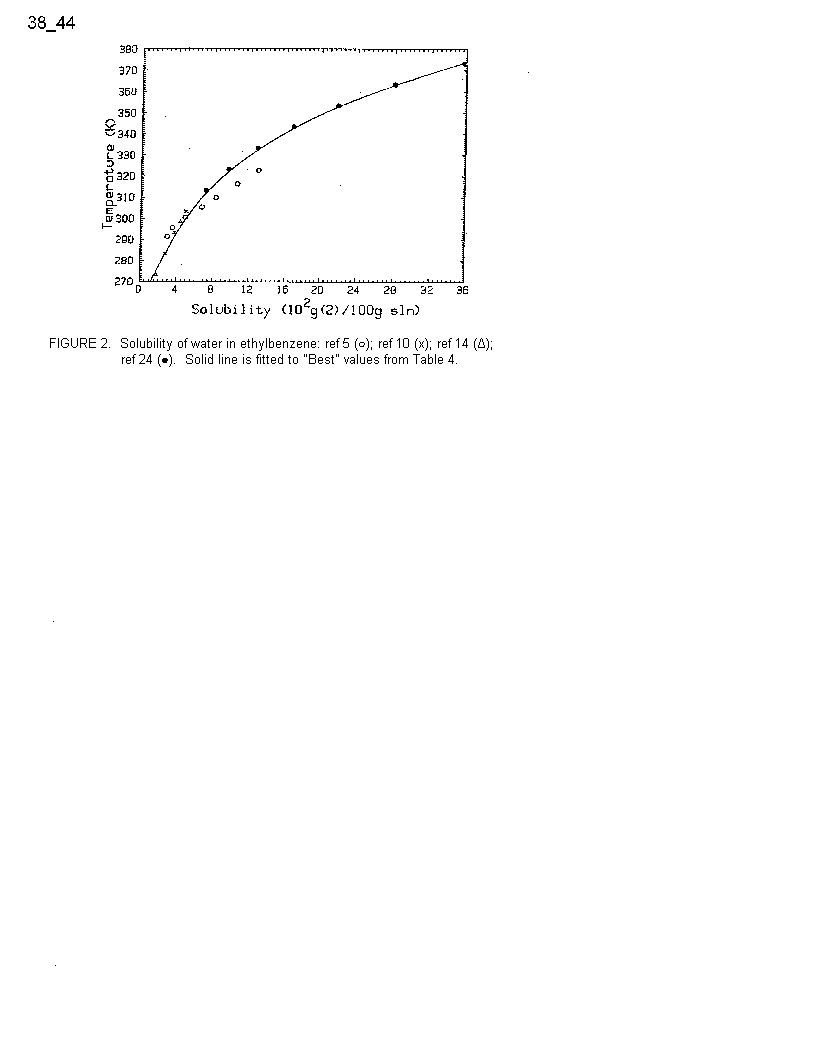
With the exception of the data of Jones and Monk (ref 7), which are reported in v/v fractions, all the available values for the solubility of water in ethylbenzene are summarized in Table 4 below. Unfortunately few of the determinations cover the same temperature range. Where comparison is possible at lower temperatures (T ≤ 298K) independent determinations are in reasonable agreement. At higher temperatures (T > 298K) the values of Filippov and Furman (ref 5) and Heidman et al. (ref 24) show an increasing divergence with increasing temperature ( Figure 2).
Thermodynamic functions derived by application of the van't Hoff equation to the various data sets are summarized in Table 5.
The thermodynamic functions derived from the data of both Englin et al. (ref 10) and Heidman et al. (ref 24) are comparable to those obtained for related, well characterized systems (e.g. water in benzene) whereas the values of Filippov and Furman (ref 5) are not. Further investigation of this system is clearly warranted.
3. MUTUAL SOLUBILITIES OF ETHYLBENZENE (1) AND WATER (2) AT ELEVATED TEMPERATURES
To clarify the relationship between the phases in equilibrium it is convenient to consider the pressure-temperature projection of the pressure-temperature-composition diagram for this system. On such a diagram ( Figure 3) phases with the same value of pressure and temperature but different composition will be located at the same point. The general typology of the phase diagram of this system is similar to that of benzene + water (except that the vapor pressure of ethylbenzene is considerably less that that of benzene). Ethylbenzene + water has type III phase behavior (using Scott and von Konynenberg's classification (ref 25, 26). This type of phase behavior is characterized by two critical loci, with one starting at the critical point of the pure component with the higher critical temperature (water in this case) and eventually approaching high pressures. The other critical locus starts at the critical point of the other pure component (ethylbenzene) and ends on a three phase (liquid-liquid-vapor) line at a critical end point.
The p-T projection of the p-T-xdiagram for this system is shown schematically in Figure 3. It is important to note that the three phase line on a p-T projection corresponds to three lines on the p-T-x diagram. In the region above the three phase line on the p-T projection, the pressure is greater than the vapor pressure and then a maxium of two liquid phases is possible. There may be one or two liquid phases depending on the overall composition. To the left of the critical line starting at the least volatile component it is possible to have one or two phases present depending on the overall composition.
The data of Guseva and Parnov (ref 9) are thought to be unreliable. The solubility's reported by these workers are considerably larger than values obtained by other workers for the systems water + benzene, + hexane, + ethylcyclohexane and + octane. The data of Heidman et al. are classified as Tentative for measurements along the three phase line. However, it should be pointed out that there is some discrepancy between the critical end point properties (574.3K, 11.2 MPa) reported by Roof (ref 13) and those reported by Heidman et al. (568.1K, 10.68 MPa). Nevertheless, the thermodynamic functions derived from the data of Heidman et al. are in reasonable agreement with those derived from lower temperature data (Table 3) and also with those of related hydrocarbons (e.g. benzene in water).
Alwani and Schneider (ref 12) have reported values of the critical properties along the critical curve starting at the critical point of ethylbenzene (cf. Figure 3).


Figures

Sources:
1
Fühner, H.; Ber. Dtsch. Chem. Ges. 1924, 57, 510-15.
2
Andrews, L. J.; Keefer, R. M.; J. Am. Chem. Soc. 1950, 72, 5034-7.
3
Klevens, H. B.; J. Phys. Chem. 1950, 54, 283-98.
4
Bohon, R. L.; Claussen, W. F.; J. Am. Chem. Soc. 1951, 73, 1571-8.
5
Filippov, T. S.; Furman, A. A.; Zh. Prikl. Khim. 1952, 25, 895-7.
6
Morrison, T. J.; Billett, F.; J. Chem. Soc. 1952, 3819-3822.
7
Jones, J. R.; Monk, C. B.; J. Chem. Soc. 1963, 2633-5.
8
McAuliffe, C.; Nature 1963, 200, 1092-3.
9
Guseva, A. N.; Parnov, E. I.; Zh. Fiz. Khim. 1964, 38, 805-6.
10
Englin, B. A.; Plate, A. F.; Tugolukov, V. M. Pryanishnikova, M. A.; Chem. Technol. Fuels Oils, 1965, 1(9), 722-726.
11
McAuliffe, C.; J. Phys. Chem. 1966, 70, 1267-1275.
12
Alwani, Z.; Schneider, G. M.; Ber. Bunsenges. Phys. Chem. 1969, 73, 294-301.
13
Roof, J. G.; J. Chem. Eng. Data 1970, 15, 301-3.
14
Polak, J.; Lu, B. C. Y.; Can. J. Chem. 1973, 51, 4018-23.
15
Brown, R. L.; Wasik, S. P.; J. Res. Natl. Bur. Stan. 1974, 78A, 453-60.
16
Sutton, C.; Calder, J. A.; J. Chem. Eng. Data 1975, 20, 320-2.
17
Price, L. C.; Am. Assoc. Petrol. Geol. Bull. 1976, 60, 213-44.
18
Korenman, I. M.; Aref'eva, R. P.; Patent USSR, 553 524, 1977.
19
Korenman, I. M.; Aref'eva, R. P.; Zh. Prikl. Khim. 1978, 51, 957-8.
20
Krzyzanowska, T.; Szeliga, J.; Nafta (Katowice) 1978, 12, 413-7.
21
Sanemasa, I.; Araki, M.; Deguchi, T.; Nagai, H.; Chem. Lett. 1981, 225-8.
22
Sanemasa, I.; Araki, M.; Deguchi, T.; Nagai, H.; Bull. Chem. Soc. Jpn. 1982, 55, 1054-62.
23
Sanemasa, I.; Arakawa, S.; Araki, M.; Deguchi, T.; Bull. Chem. Soc. Jpn. 1984, 57, 1539-44.
24
Heidman, J. L.; Tsonopoulos, C.; Brady, C. J.; Wilson, G. M.; A. I. Ch. E. J. 1985, 31, 376-84.
25
van Konynenburg, P. H.; Scott, R. L.; Phil. Trans. Roy. Soc. A
1980, 298, 495.
26
Hicks, C. P.; Young, C. L.; Chem. Rev. 1975, 75, 119.